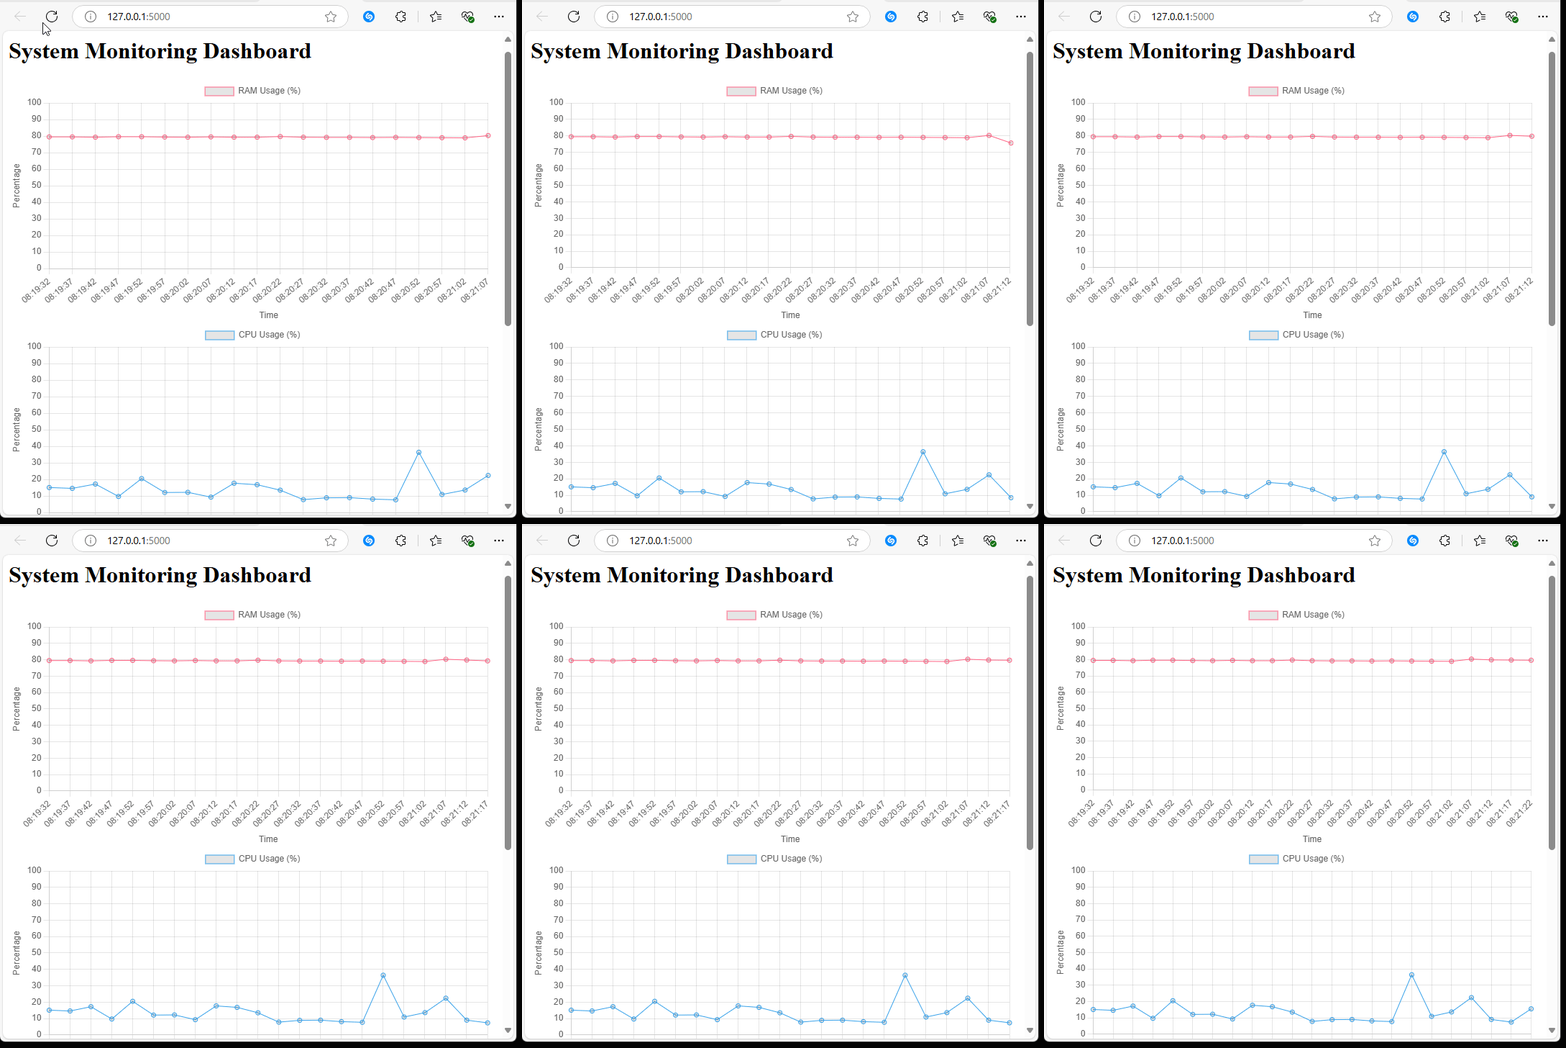
Create a simple system monitoring dashboard using Python, Chart.js, and Flask. This dashboard will display real-time metrics for RAM, CPU, and Disk usage in a web browser.
For this project, we’ll use the following packages:
- Flask for the web application
- Psutil for fetching system statistics
- Chart.js to create interactive graphs

Project Setup
Create a Project Folder
Begin by creating a folder for the project. Open a terminal (or command prompt) and create a new directory.
mkdir system_monitor_dashboard
cd system_monitor_dashboard
Step 2: Set Up a Virtual Environment
Isolating your project dependencies is important. We’ll create a virtual environment to keep our environment clean and predictable.
For Windows:
python -m venv venv
venv\Scripts\activate
For Linux/Mac:
python3 -m venv venv
source venv/bin/activate
Let’s install the necessary dependencies. Run the following command in your terminal:
pip install Flask psutilSetting Up Flask
To begin, we’ll create a basic Flask app. This app will serve as our dashboard and handle updates every few seconds.
app.py
from flask import Flask, jsonify, render_template
import psutil
from datetime import datetime
import logging

# Initialize Flask app
app = Flask(__name__)

# Enable logging to monitor errors or important information
logging.basicConfig(level=logging.INFO)

# Function to fetch system statistics
def get_system_stats():
    try:
        memory = psutil.virtual_memory().percent
        cpu = psutil.cpu_percent(interval=1)
        disk = psutil.disk_usage('/').percent
        return {
            'time': datetime.now().strftime('%H:%M:%S'),
            'ram': memory,
            'cpu': cpu,
            'disk': disk
        }
    except Exception as e:
        logging.error(f"Error fetching system stats: {e}")
        return {}

@app.route('/')
def index():
    return render_template('index.html')

@app.route('/data')
def data():
    stats = get_system_stats()
    return jsonify(stats)

if __name__ == '__main__':
    app.run(debug=True)
In this script, we define the core functions of the Flask app. The / route renders the main page, while the /data route returns system stats in JSON format.
Creating the HTML Template
Next, we need to create a template to display the dashboard. We’ll use Chart.js to visualize the data. In Flask, templates are stored in the templates folder.
templates/index.html
<!DOCTYPE html>
<html lang="en">
<head>
    <meta charset="UTF-8">
    <meta name="viewport" content="width=device-width, initial-scale=1.0">
    <title>System Monitoring Dashboard</title>
    <script src="https://cdn.jsdelivr.net/npm/chart.js"></script>
</head>
<body>
    <h1>System Monitoring Dashboard</h1>

    <canvas id="ramChart" width="400" height="200"></canvas>
    <canvas id="cpuChart" width="400" height="200"></canvas>
    <canvas id="diskChart" width="400" height="200"></canvas>

    <script>
        let ramChart = new Chart(document.getElementById('ramChart').getContext('2d'), {
            type: 'line',
            data: {
                labels: [],
                datasets: [{
                    label: 'RAM Usage (%)',
                    data: [],
                    borderColor: 'rgba(255, 99, 132, 1)',
                    borderWidth: 1,
                    fill: false
                }]
            },
            options: {
                scales: {
                    x: { title: { display: true, text: 'Time' } },
                    y: { title: { display: true, text: 'Percentage' }, min: 0, max: 100 }
                }
            }
        });

        let cpuChart = new Chart(document.getElementById('cpuChart').getContext('2d'), {
            type: 'line',
            data: {
                labels: [],
                datasets: [{
                    label: 'CPU Usage (%)',
                    data: [],
                    borderColor: 'rgba(54, 162, 235, 1)',
                    borderWidth: 1,
                    fill: false
                }]
            },
            options: {
                scales: {
                    x: { title: { display: true, text: 'Time' } },
                    y: { title: { display: true, text: 'Percentage' }, min: 0, max: 100 }
                }
            }
        });

        let diskChart = new Chart(document.getElementById('diskChart').getContext('2d'), {
            type: 'line',
            data: {
                labels: [],
                datasets: [{
                    label: 'Disk Usage (%)',
                    data: [],
                    borderColor: 'rgba(75, 192, 192, 1)',
                    borderWidth: 1,
                    fill: false
                }]
            },
            options: {
                scales: {
                    x: { title: { display: true, text: 'Time' } },
                    y: { title: { display: true, text: 'Percentage' }, min: 0, max: 100 }
                }
            }
        });

        function updateCharts() {
            fetch('/data')
                .then(response => response.json())
                .then(data => {
                    let time = data.time;

                    // RAM Chart
                    ramChart.data.labels.push(time);
                    ramChart.data.datasets[0].data.push(data.ram);
                    ramChart.update();

                    // CPU Chart
                    cpuChart.data.labels.push(time);
                    cpuChart.data.datasets[0].data.push(data.cpu);
                    cpuChart.update();

                    // Disk Chart
                    diskChart.data.labels.push(time);
                    diskChart.data.datasets[0].data.push(data.disk);
                    diskChart.update();
                });
        }

        setInterval(updateCharts, 5000);
    </script>
</body>
</html>
This HTML template includes three line charts for RAM, CPU, and Disk usage. It uses the Chart.js library to create and update the charts. The data is fetched from the /data route every five seconds using the setInterval function.
Running the Dashboard
To launch the dashboard, run the following command in your terminal:
python app.pyOpen your browser and navigate to http://127.0.0.1:5000/. You should see real-time charts updating every five seconds, displaying the current RAM, CPU, and Disk usage.
For a similar article but using dash/plotly visit this link: https://medium.com/@ccpythonprogramming/building-a-real-time-system-monitoring-dashboard-with-python-6e09ff15e0ff
Thank you for following along with this tutorial. We hope you found it helpful and informative. If you have any questions, or if you would like to suggest new Python code examples or topics for future tutorials/articles, please feel free to join and comment. Your feedback and suggestions are always welcome!
You can find the same tutorial on Medium.com.


