Interactive maps are great for visualizing geographical data. Let’s create an interactive map using Python. We’ll utilize the Folium library to generate maps based on csv data.
Create a Virtual Environment
In the terminal, navigate to your project directory if you’re not already there. Then, run the following command:
Windows:
python -m venv venvLinux/Mac:
python3 -m venv venvActivate the virtual environment:
Windows:
venv\Scripts\activate.batLinux/Mac:
source venv/bin/activateNote: When exiting out of your code it’s suggested you deactivate then exit like so:
deactivate
# Wait until virtual env deactivates, then
exit
Prerequisites
Before starting, make sure you have Python installed on your system. We’ll also need to install some libraries. Open your terminal and run:
pip install folium
pip install pandas
Project Structure
We’ll set up a simple project with the following files:
map_app.py: The main Python script.data.csv: A CSV file containing geographical data.
Creating the Data File
First, create the data.csv file. This file will hold latitude and longitude coordinates along with location names. Open a text editor and add:
name,latitude,longitude
Location1,37.7749,-122.4194
Location2,34.0522,-118.2437
Location3,40.7128,-74.0060
Save this file as data.csv in your project directory.
Writing the Python Script
Next, create the map_app.py file. This script will read data from the CSV file and generate the interactive map.
import folium
import pandas as pd

# Read data from CSV
data = pd.read_csv('data.csv')

# Create a map centered at the average coordinates
average_lat = data['latitude'].mean()
average_lon = data['longitude'].mean()
my_map = folium.Map(location=[average_lat, average_lon], zoom_start=5)

# Add markers to the map
for index, row in data.iterrows():
    folium.Marker(
        location=[row['latitude'], row['longitude']],
        popup=row['name']
    ).add_to(my_map)

# Save the map to an HTML file
my_map.save('interactive_map.html')
Explanation of the Code
- Imports: We import
foliumfor map creation andpandasfor data handling. - Reading Data: The
pd.read_csv('data.csv')function reads the CSV file into a DataFrame. - Calculating Center: We compute the average latitude and longitude to center the map.
- Creating the Map:
folium.Map()initializes a new map object. Folium brings in the default ‘earth’ map similar to goolge maps. - Adding Markers: We loop through each row in the DataFrame and add a marker to the map.
- Saving the Map: The
my_map.save('interactive_map.html')function saves the map as an HTML file.
Running the Script
Save the map_app.py file. In your terminal, navigate to your project directory and execute:
python map_app.pyhis command runs the script. After completion, you’ll find a new file named interactive_map.html in your directory.
Viewing the Map
Open interactive_map.html in a web browser. You’ll see an interactive map with markers at the specified locations. Clicking on a marker displays the location name.
Customizing the Map
You can enhance the map by changing its style or adding more features.
Changing the Map Tiles
Folium allows you to alter the map tiles. For instance:
my_map = folium.Map(
    location=[average_lat, average_lon],
    zoom_start=5,
    tiles='Stamen Terrain'
)
This change gives the map a different look.
Adding a Feature Group
Grouping markers can make the map more organized. Here’s how:
fg = folium.FeatureGroup(name='My Map')

for index, row in data.iterrows():
    fg.add_child(
        folium.Marker(
            location=[row['latitude'], row['longitude']],
            popup=row['name']
        )
    )

my_map.add_child(fg)
Adding a Layer Control
If you have multiple feature groups, adding a layer control improves user experience:
my_map.add_child(folium.LayerControl())This addition allows users to toggle different layers on the map.
In the above code, you will see the name value when you click on a marker. What if you wanted to see additional data?
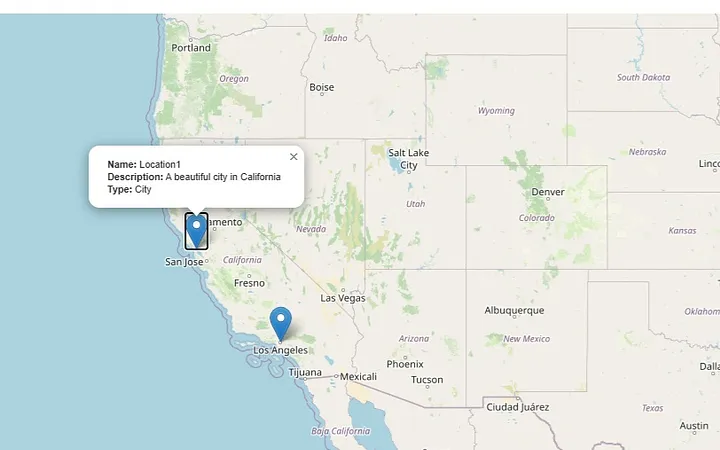
To display more information when a marker is clicked on the map, you can customize the popup content to include more data, such as additional text, HTML formatting, or even images.
Let’s say your data.csv file has additional information like description and type columns:
name,latitude,longitude,description,type
Location1,37.7749,-122.4194,"A beautiful city in California",City
Location2,34.0522,-118.2437,"Known for its entertainment industry",City
Location3,40.7128,-74.0060,"A bustling metropolis in New York",City
You can modify the code in map_app.py to include this extra information in the popup. Here’s how you can modify the code:
import folium
import pandas as pd

# Read data from CSV
data = pd.read_csv('data.csv')

# Create a map centered at the average coordinates
average_lat = data['latitude'].mean()
average_lon = data['longitude'].mean()
my_map = folium.Map(location=[average_lat, average_lon], zoom_start=5)

# Add markers to the map with more information in the popup
for index, row in data.iterrows():
    popup_content = f"""
    <b>Name:</b> {row['name']}<br>
    <b>Description:</b> {row['description']}<br>
    <b>Type:</b> {row['type']}
    """
    folium.Marker(
        location=[row['latitude'], row['longitude']],
        popup=folium.Popup(popup_content, max_width=250)
    ).add_to(my_map)

# Save the map to an HTML file
my_map.save('interactive_map.html')
The following code will generate the data.csv file for you.
import csv
import os

# Define the CSV file name and location
file_name = "data.csv"
file_path = os.path.join(os.getcwd(), file_name)

# Data to be written to CSV
data = [
    ["name", "latitude", "longitude", "description", "type"],
    ["Location1", 37.7749, -122.4194, "A beautiful city in California", "City"],
    ["Location2", 34.0522, -118.2437, "Known for its entertainment industry", "City"],
    ["Location3", 40.7128, -74.0060, "A bustling metropolis in New York", "City"]
]

# Write data to CSV
with open(file_path, mode='w', newline='', encoding='utf-8') as file:
    writer = csv.writer(file)
    writer.writerows(data)

print(f"CSV file '{file_name}' has been created at: {file_path}")
Final output when viewing the .html file:
Finally, what if you want to use your own map (a map of a building or a map of a campus…) — you can achieve this by overlaying a custom image as a tile layer on the map.
Here’s how you can do this:
Steps to Use a Custom Map (Image) with Folium
- Prepare the Image: Make sure you have an image of your building map in a format like
.pngor.jpg. You’ll need to know the geographical coordinates (or any coordinate system) of the four corners of your map image to properly overlay it on a Folium map. - Install Required Libraries: Make sure
brancalibrary for tile layers is installed:
pip show brancaOverlay the Image on Folium Map: Use the ImageOverlay class from Folium to overlay the custom image on your map.
Example Python Code:
import folium
from folium.plugins import ImageOverlay
from folium import Map, LayerControl
import os

# Define the coordinates for the four corners of your image (in this example, it's just an example)
# These coordinates should correspond to the top-left and bottom-right corners of your building map
bounds = [[37.773972, -122.431297], [37.774970, -122.430297]]  # Example coordinates

# Create a base map centered at a location near the building
my_map = folium.Map(location=[37.7745, -122.4308], zoom_start=18)

# Path to your custom building map image
image_path = os.path.join(os.getcwd(), 'building_map.png')

# Overlay the custom image (e.g., floor plan or building map)
image_overlay = ImageOverlay(
    name='Building Map',
    image=image_path,
    bounds=bounds,  # Geographical bounds (the corners of your image)
    opacity=0.7,  # Set opacity (optional)
    interactive=True
)

# Add the overlay to the map
image_overlay.add_to(my_map)

# Add layer control to toggle the overlay on/off
folium.LayerControl().add_to(my_map)

# Save the map to an HTML file
my_map.save('building_map_with_overlay.html')

print("Map created: building_map_with_overlay.html")
Explanation:
- bounds: This defines the geographical coordinates where the image will be placed. You should replace the
boundsvariable with the coordinates corresponding to your building map (e.g., the latitude and longitude of the top-left and bottom-right corners). - ImageOverlay: This overlays your custom image (e.g., your building’s map) on top of the Folium base map. The image is positioned based on the bounds you define.
- LayerControl: This allows users to toggle the custom overlay on and off.
Running the Script:
- Place your building map image (
building_map.pngor similar) in the same directory as your script. - Run the script. It will generate an HTML file (
building_map_with_overlay.html) which you can open in a browser to view your custom map overlaid on a Folium map.
Notes:
- You need to ensure that the image is georeferenced properly by determining the actual latitude and longitude (or a custom coordinate system) for the image corners.
- If you don’t have geographical coordinates, you can still use pixel coordinates and overlay it, but the zoom and pan functionalities might not work as expected.
Thank you for following along with this tutorial. We hope you found it helpful and informative. If you have any questions, or if you would like to suggest new Python code examples or topics for future tutorials/articles, please feel free to join and comment. Your feedback and suggestions are always welcome!
You can find the same tutorial on Medium.com.